


Articles/Essays – Volume 38, No. 4
The Diverse Sheep of Israel: Should the Shepherds Resemble Their Flocks?
Recently, my wife and I became foster parents to two teenagers of Haitian ancestry, a fourteen-year-old girl and an eighteen-year-old boy. It is our first-time parenting experience, and “interesting” is not an adjective that does justice to it. It has been extremely rewarding, very challenging, very frustrating, and, often, just plain fun. One critical lesson I have learned is to be much more sensitive to matters of race and minorities, particularly the presence and current place of ethnic minorities within the Church. For example, when we go to church and see many white faces, but few of other races, even in metropolitan Boston, and when every single one of the Twelve Apostles and nearly the entire First and Second Quorums of the Seventy are of European descent, I am left to wonder what place ethnic minorities have in the Church. This preponderance of “whiteness” occurs in a Church in which over 50 percent of the members do not live in the United Sates,[1] yet the Church leadership is dominated by persons of European descent.
In this paper, I will analyze the membership of the Church (including both historical data and future projections), as well as the leadership in the Church, to determine the percentages of different ethnic groups in the Church at both the general membership level and at the level of the General Authorities. While earlier analyses have focused on projecting the growth of the Church as a whole, this study is the first attempt to quantify the numbers of different ethnic groups within Mormonism. I will then discuss some of the problems and opportunities that the Church faces, given the large increase in ethnic minorities into the Church.
Overview of LDS Membership and Ethnic Minorities
The Church has made few public predictions about its growth. However, in the sesquicentennial year of 1980, the Church estimated the number of members and units it would have in 2000 (estimated 11.14 million members, 3,600 stakes, 460 missions, and 29,000 wards and branches). These estimates proved to be fairly accurate for the number of members and local units (11.06 million members and 26,143 wards/branches) but significantly overly optimistic about the number of stakes (2,581) and missions (334) in 2000.[2]
Besides the limited projections made public by the LDS Church, a considerable body of published literature exists on estimating current and future membership of the Church. However, little of this research is focused on determining the number of members of particular ethnic groups, either retrospectively or as projected. Rodney Stark, a well-known sociologist, in 1984 predicted that the Mormon membership would reach between 65 million and 280 million in 2080, based on the then-current growth rates of 30-50 percent per decade.[3] In 1995, Stark revisited his estimates and found they had held true through 1994. In 1985, he had estimated the Church would have between 6.7 million and 8.2 million members; the actual figure for 1995 was 9.0 million.[4] Even for 2000, his estimates were low compared to the actual number of members; he estimated 7.8 million to 10.4 million, but there were actually 11.0 million. However, his estimates were based on exponential growth rates, while other analyses, using the linear growth rate of a consistent 250,000-300,000 new converts annually, have challenged Stark’s projections.[5]
David Knowlton and Mark Grover have both recently addressed the problems associated with determining the number of members of the Church in Latin America.[6] Theirs is the most specific demographic work done to date on Latin America. Darius Gray, speaking at the Mormon History Association annual meeting in 2003, said that “the number of black Saints in Africa now exceeds 154,000.[7] He did not say how he had derived this figure.
According to Jesse Embry, “There is no practical way to determine how many Hispanic Americans, Asian Americans, Polynesian Americans or African Americans are members (of the Church).”[8] One reason for the difficulty is that the Church does not collect ethnicity on membership, baptismal, ordination, or temple records—nor should it—except to predict that Spanish will be the most common spoken language in the Church by 2020.[9] Thus, my figures are estimated or calculated using available data. The value of such an analysis is clear and could benefit not only the Church leadership, but also the general membership and sociologists.
To begin analyzing the Church membership, one can look at the macro population trends over the last ten years.[10] In December 1992, the Church had just over 8.0 million members, 43.6 percent of them living outside the United States, while in December 2002, it had nearly 12 million members, with 53.8 percent living outside the United States. The shift in membership over this ten-year period is due to the high rate of convert baptisms outside the United States.[11] It also suggests that the number of nonwhite Mormons must be close to 50 percent since, outside the United States, there are just a few hundred thousand white members in Europe, Canada, Australia, New Zealand, and other countries.
To evaluate the current ethnic makeup of Church membership today, I performed two different analyses, each using a different method and using available data sources with appropriate assumptions where necessary. For the purposes of this study, I chose four ethnic groups, a simplification of the many diverse ethnicities within the Church and world. However, it makes the analysis simpler and reflects some of the current scientific thinking about racial groupings in the world.[12] The four ethnic groups are: Latin, black, Asian/Pacific, and European non-Latin (hereafter ethnically European).
Within the Latin grouping, I have included members whose ethnic backgrounds are either Spanish or Portuguese, including all Spanish-speaking members in South and Central America, Spain, Portugal, and the Caribbean. While South America, Central America, and the Caribbean are obviously different both geographically and economically from Spain and Portugal, the ethnic background of more than 80 percent of the people in Central and South America is European (predominantly Spanish and Portuguese). In addition, U.S. government agencies group Spaniards and Spanish-speakers of Central America, South America, and the Caribbean as Hispanic.[13]
Within the black grouping, I have included members of African ancestry including blacks in Africa, the United States, Canada, and Europe as well as those of African descent living in the Caribbean or Brazil; I exclude members in these last two areas from the Latin group to prevent double counting. My reason for excluding South American blacks from the Latin group is because of the racial separation these members experienced prior to 1978; in essence, the priesthood ban created a different “Church” experience for black members. This exclusion affects a small percentage of the membership in South and Central America: 5 percent in this analysis, which maps nicely to the 6 percent of Brazil’s population with black ancestry.[14]
The Asian/Pacific group includes members whose ancestors are from Asia and the Pacific Islands, including those living in the United States, Canada, or Europe who are of Asian or Polynesian descent. While the Polynesian culture is obviously very different from the Asian cultures, I include members of Polynesian descent in the Asian/Pacific grouping because the 250,000-300,000 total members of Polynesian descent in the Church are a small percentage of the ethnic minorities: 2 percent of total Church members, less than 5 percent of the total number of ethnic minorities in the Church, and approximately 23 percent[15] of the Asian/Pacific ethnic group in this analysis. Therefore, they do not warrant a separate ethnic group in this analysis.[16]
Finally, the ethnically European group includes all members of European descent from eastern, southern, northern, and western Europe except for Spain and Portugal; I count those members in the Latin group. This ethnic group is synonymous with the traditional “white” or “Caucasian” ethnic groups; however, “ethnically European” links their common ancestry to a distinct geographic locale, which simplifies the already complex analysis performed.
Ethnic Minority Population Estimates
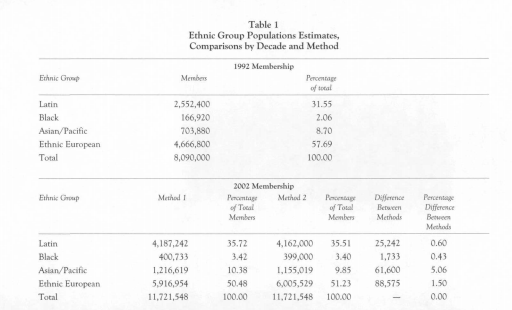
The Church collects data on the number of LDS members in each country. For my first analysis, I used these data to calculate the number of members in each ethnic group. For 2002 data, I aggregated the member ship numbers for countries with a common ethnic group. The Latin group included all of South America (with the exception of an estimated 150,000 black members in Brazil),[17] Mexico, all of Central America, and the Caribbean, excluding 15,300 members in Jamaica, Haiti, and six small islands whose residents are mostly of African descent.[18] The total for the Latin grouping was ~3.8 million from these areas plus -52,000 members from Spain and Portugal and -332,000 Latinos in predominantly ethnically European countries: the United States, Canada, Europe, Australia, and New Zealand.[19] Adding these figures of Latin (including Portuguese) Latter-day Saints yields a total of ~4.19 million members or 35.72 percent of the total Church membership. (See Table 1.)
[Editor’s Note: For Table 1: Ethnic Group Populations Estimates, Comparisons by Decade and Method, see PDF below, p. 62]
I used the same method to estimate the number of Asian/Pacific members. I first calculated the number of members in Asian countries and on Pacific Islands (minus Australia and New Zealand). The totals were -803,000 and -181,000, respectively. I calculated an additional 133,000 Asians and 100,000 Pacific Islanders in predominantly ethnically European countries to produce a total of 935,000 Asians and 280,000 Pacific Islanders. The Asian/Pacific total thus stood at 1.22 million Asian/Pacific Mormons or 10.38 percent of the Church membership.
Although there are some ethnically European members in Africa, particularly in South Africa, I assumed, for the purposes of these calculations, that all African members are of black lineage because South Africa’s -29,000 members do not significantly alter the data output. Using the same methodology as in the first two groups, I calculated 136,000 black members in Africa, added Brazil’s 150,000 black members, plus 5,300 members from Jamaica, Haiti, and the six small islands named above, and the ~ 100,000 black members in mostly ethnically European countries. (See note 18.) These figures yield a total of -400,000 black members of the Church or 3.42 percent of the total membership.
I then calculated the number of ethnically European members by subtracting the number of black, Latin, and Asian/Pacific members from the total Church membership. The result was 5.92 million ethnically European members or 50.48 percent of the total members of the Church. Applying this same methodology to the membership in 1992 yields a total of -2.55 million Latin members, -704,000 Asian/Pacific members, 166,000 black members, and 4.67 million ethnically European members: 31.55 percent, 8.70 percent, 2.06 percent, and 57.69 percent, respectively. (See Table I.)[20]
My second method of analysis used the total number of members who speak a particular language; the top ten languages account for 91 percent of all Church members. The numbers from this method resulted in the following percentages for each ethnic group: Latin 35.51 percent; Asian/Pacific 9.85 percent; black 3.40 percent; and ethnically European 51.23 percent. (See Table 1.) These totals correspond very closely to those derived from the first analysis, suggesting that the two methods are similar enough in output to provide confidence that the figures represent each racial group’s share of total Church membership with considerable accuracy.
Ethnic Europeans are rapidly becoming a minority ethnic group in the Church. In 1996, more members were found outside the United States than in it. In 2000, more non-English-speakers than English-speakers were Mormons.[21] To determine the approximate year when ethnic Europeans will comprise less than 50 percent of the total membership of the Church and when ethnic Europeans will no longer be the Church’s largest ethnic group, I projected future membership numbers using an annual growth rate for each ethnic group based on the growth rate of that ethnic group from 1992 to 2002. Projecting these growth rates for twenty years for each group, then aggregating them to determine the entire Church membership, shows that ethnic Europeans comprised less than 50 percent of the Church membership in late 2003 or early 2004. When analyzed further, it shows that ethnic Europeans will be overtaken by the Latin group as the largest ethnic group in the Church in 2016 or 2017 (Figure 1) when Church membership will number ~ 20 million. At that point, ethnic European and Latin members will each comprise ~40 percent of the membership of the Church with ~ 13 percent Asian/Pacific members and ~7 percent black members.[22] This projection compares favorably to the Church’s 2000 estimate that Spanish would be the largest language group in the Church by 2020. Since my estimates include the Portuguese-speaking population as well, 2016 or 2017 nicely matches the Church’s estimate.
[Editor’s Note: For Figure 1: Percent of Members in Each Ethnic Group 2002-2020 and Figure 2: Comparison of Different Membership Projection Methodologies 2000-2040, see PDF below, p. 66]
Comparison to Other Population Estimates
As Imentioned above, several other methods have been employed for estimating future Church membership numbers. To appraise the validity of my methods in estimating total membership through 2040, I compared the results with three previous estimates. I projected calculated growth rates from 1992-2002 to 2020, then discounted these growth rates 20 percent to prevent exponential growth from occurring between 2020 and 2040. Figure 2 shows my method compared to the Stark, Anderson, and Loomis estimates. Figure 2 focuses on two fixed years (2020 and 2040) for comparison. Stark had the highest estimates at both points: ~23.5 million and ~52.8 million, respectively. Loomis and Anderson had similar estimates for both years: ~ 17.1 million in 2020 and -23.1 million in 2040 for Loomis, and -19.6 million in 2020, and -26.8 million in 2040 for Anderson. My estimate fell between the three estimates with -22.7 million in 2020 and -41.4 million in 2040. My estimates are, thus, 3.5 percent lower than the highest estimate in 2020 and 24.5 percent higher than the lowest estimate in 2020 and 28.4 percent lower than the highest estimate in 2040 and 43.8 percent higher than the lowest estimate in 2040, using my numbers as the baseline.
Figure 2 shows significant divergence between the high exponential growth projected by Stark and the linear growth projected by Loomis and Anderson. My projection, a hybrid, is a good reconciliation between these methods. Stark’s exponential growth assumptions seem unlikely since they do not take into account the law of large numbers, while the linear-growth assumptions of Loomis and Anderson project a continuation of the current -300,000 converts per year for the next thirty-five years. This assumption also seems unlikely, as the number oi missionaries will undoubtedly increase, the Church will employ new ways of doing missionary work, and such events as natural disasters, terrorism, war, etc., will continue to push people to search for religion. Thus, an increase in the rate of convert baptisms in the future seems likely. In short, my projections, based on a bottom-up projection of membership growth compared to the top-line growth projections of Loomis, Anderson, and Stark, seem valid, accurate, and in line with these other membership projections.
[Editor’s Note: For Table 2: Comparison of Ethnic Minorities among General Authorities, 1992, 2002, see PDF below, p. 68]
While my analysis seems valid, certain caveats are in order: (1) The assumption that ethnic group growth rates will remain identical to the growth rates seen from 1992 to 2002 does not account for the different growth rates that will inevitably be seen in reality; (2) the decrease in all growth rates by 20 percent after 2020 also assumes that all ethnic groups will have the same relative decline in growth rates from 2020 to 2040—again unlikely; and (3) it is probable that the growth rates will decline at a faster rate for the larger ethnic groups (e.g., ethnic European and Latin) than for the Asian/Pacific and black ethnic groups due to the law of large numbers. However, even with these caveats, the analysis—the first with a bottom-up approach to membership projections based on differential growth rates of the major ethnic groups in the Church rather than top-line growth projections—is still persuasive.
Ethnic Minority Representation in General Authorities
I performed a similar analysis on General Authorities to assess what percentage of the male leaders (the First Presidency, Twelve, Presiding Bishopric, Presidency of the Seventy, and the First and Second Quorums of the Seventy) are from the four ethnic groups. A comparison between 1992 and 2002 quorums showed no ethnic minorities in the First presidency, Quorum of the Twelve, Presidency of the Seventy, and Presiding Bishopric in either 1992 or 2002. (See Table 2.) The First and Second Quorums of the Seventy had fourteen ethnic minority members in 1992 and eight in 2002 for a total of 13.6 percent and 7.4 percent of the total General Authorities, respectively. Thus, in the last ten years, the number of ethnic minorities serving as General Authorities has declined by nearly half, while the total number of General Authorities has actually increased by five.[23]
In short, while the total number of ethnic minorities in the Church surpassed 50 percent in 2003-04, the number of ethnic minorities serving in the General Authority ranks has actually declined by half over the last ten years. Many members of non-European descent do serve in the Area Authority Seventy ranks; however, they are not considered General Authorities and, therefore, do not experience the same “popularity” and exposure (e.g., general conference presence and talks) as General Authorities. In addition, the Area Authority Seventy calling was not instituted until 1997.
Implications of This Analysis
As the Church has spread across the globe, it has encountered certain problems which might be ameliorated if more brethren of non-European descent were found among the General Authorities. These problems affect both the Church as an institution and the converts as individuals.[24] At the institutional level, the Church is widely regarded internationally as a “white American” denomination, an image which, in extreme cases at least, has made it susceptible to violence in the form of church bombings and attacks on its missionaries.[25] Furthermore, I feel that this image has contributed to the fact that there has been no appreciable increase in convert baptisms around the world for the past dozen years.[26] Nor is a single change likely to alter this pattern. The more flexible missionary teaching approach seems promising, but a more ethnically diverse top leadership might give the Church a more appealing international image, both to its critics and to its potential converts.
At the individual level, members in most parts of the world do not remain active, go on missions, or marry in the temple at the same rates as in North America. Again, there are many reasons for such discrepancies.[27] One reason might be that members in those parts of the world must find ways to relate to official sermons, lessons, and hymns which, even when translated into local languages, do not necessarily translate effectively into local cultures with their own respective traditions, musical and poetical forms, heroes, symbols, and even “pioneer stories.”[28] Furthermore, members, especially young members, in Africa, Latin America, and Asia face a serious shortage of high-level role models among their own local leaders, valuable though these local leaders might be, since they do not have the benefit of historic or contemporary apostles from Europe or North America available to ethnically European LDS youth. Many of the ethnic youth with whom I have discussed this issue say that they are not expected to serve missions, because they see only ethnic Europeans serving as missionaries and as Church leaders. While this information is clearly anecdotal, it does highlight the integration gap into the mainstream Church that some ethnic minorities face. All these conditions for members at the grassroots might be mitigated with greater participation among the General Authorities of these ethnic groups.
As LDS membership has shifted demographically, largely to Spanish-speaking and other populations outside North America, Church leaders have not, of course, been oblivious to problems such as those mentioned above.[29] The challenges of administering a worldwide Church provided the theme of an Ensign article thirty years ago.[30] Since then (and even before), the scriptures and lesson materials of the Church have been translated into many languages; and lesson guides and materials have been simplified to allow for more focused adaptations to local needs. During President Hinckley’s decade of leadership, greater emphasis has been placed upon member retention and upon local leadership development in priesthood training sessions televised around the world; three apostles have been sent to live among the Saints abroad: Elder Jeffrey R. Holland to Chile, Elder Dallin H. Oaks to the Philippines, and Elder L. Tom Perry to Europe. The creation of the Third, Fourth, and Fifth Quorums of Seventy has brought many Area Authorities from Latin America, Asia, and Africa into higher levels of leadership.
These inspired and progressive measures will, in time, certainly enhance the image and effectiveness of the Church as a global institution. Meanwhile, however, we might look forward to some acceleration of these processes and to an even greater enhancement of the international and intercultural diversity and voice in the ranks of the top Church leadership. We might, for example, anticipate many more calls to the First and Second Quorum of Seventy—and even to the Quorum of the Twelve—from outside North America and Europe.[31] At these general organizational levels, leaders from Asia, Africa, and Latin America can provide models of spiritual achievement and leadership to the entire world, as well as to the Saints in their respective homelands. To be sure, such calls might complicate communication across languages among the General Authorities, but that predicament is inevitable as Spanish gradually becomes the most common language among the Latter-day Saints worldwide. That kind of ethnic diversity at the most public general level of our leadership would emphasize the implicit message to the world, and especially to the world’s Latter-day Saints, that all the General Authorities, and not just those who are ethnic Europeans, can relate to the experiences of the common members of the world and can speak for the Lord to those people.
As the Church reaches into the “grassroots” in various parts of the world, it could also increase the frequency with which non-European faces and experiences are depicted in Church magazines, lesson manuals, and videos, continuing an already noticeable trend. Another important form of the Church’s reach into the grassroots takes place in the regular conferences, not only the annual and semi-annual general conferences, but also the various auxiliary conferences and women’s conferences. Perhaps leaders from various ethnic groups can be called to executive and general board positions in the auxiliaries, and conferences might be held more often in locations other than Salt Lake City,[32] as well as in languages other than English, with interpreters rendering talks into English rather than from English.[33] We might even see large numbers of happily singing faces from various lands in the Tabernacle Choir!
Conclusion
We live in exciting and unprecedented times as Latter-day Saints. The change in our membership composition from predominantly ethnic European to predominantly Latin and other ethnic groups has presented the Church with many new and enduring problems, as well as opportunities. As we look to the future, we should expect to see among our General Authorities and other general leaders, men and women drawn increasingly from parts of the world outside Europe and America, as the Holy Spirit directs. These new leaders will give the Church an increasingly international image and outlook, and will offer members from all cultures spiritual models with which they can readily identify. Then Church leaders will truly be “all alike” unto the Saints as we are now “all alike unto God” (2 Ne. 26:33).
[1] Mormons living outside the United States outnumbered those inside as of February 25, 1996. “More Members Now outside U.S. than in U.S.,” Ensign, March 1996, 76.
[2] “A Statistical Profile: What Numbers Tell Us about Ourselves,” Ensign, April 1980, 15.
[3] Rodney Stark, “The Rise of a New World Faith,” Review of Religious Research 26, no. 3 (1984):18-27.
[4] Rodney Stark, “So Far, So Good: A Brief Assessment of Mormon Membership Projections,” Review of Religious Research 38, no. 2 (1996): 175-87. 5.
[5] Richard Loomis, “Church Growth,” unpublished paper presented at the Association for the Sociology of Religion, August 15-17, 2002, Chicago; Duwayne Anderson, “Estimates for the Future Membership of the Church of Je sus Christ of Latter-day Saints,” retrieved in November 2004 from www.lds-mor mon.com/churchgrowthrates.shtml. See also David Stewart, “The Law of the Harvest: Practical Principles for Effective Missionary Work,” unpublished manuscript, retrieved on November 2004 from www.cumorah.com/report.html; Glenmary Research Center, “Religious Congregations and Membership: 2000,” 2002, American Religion DataArchive (2000), www.thearda.com; and Lowell C. “Ben” Bennion and Lawrence A. Young, “The Uncertain Dynamics of LDS Expansion, 1950-2020,” Dialogue: A Journal of Mormon Thought 29, no. 1 (Spring 1996): 8-32.
[6] David Clark Knowlton, “How Many Members Are There Really? Two Censuses and the Meaning of Church Membership in Chile and Mexico,” Dialogue: A Journal of Mormon Thought 38, no. 2 (Summer 2005): 53-78; Mark Grover, “The Maturing of the Oak: The Dynamics of LDS Growth in Latin America,” Dialogue: A Journal of Mormon Thought 38, no. 2 (Summer 2005): 79-104.
[7] Quoted in the Deseret News, online edition, May 27, 2003, available at www.deseretnews.com.
[8] Jesse Embry, Black Saints in a White Church (Salt Lake City: Signature Books, 1994), 18.
[9] “Historic Milestone Achieved: More Non-English-Speaking Members Now Than English-Speaking,” Ensign, September 2000, 76.
[10] I retrieved all membership data in this analysis in October 2003 from www.lds.org; these data are reported as year-end 2002 membership data or are from Deseret News Church Almanac 1993-1994 (Salt Lake City: Deseret News, 1993), which includes data from year-end 1992.
[11] Bradley Walker, “Spreading Zion Southward: Part II,” Dialogue: A Journal of Mormon Thought 36, no. 1 (Spring 2003): 33-47, calculates that 75 percent of baptisms in the 1990s were in less-developed countries.
[12] Hua Tang et al., “Genetic Structure, Self-Identified Race/Ethnicity, and Confounding in Case-Control Association Studies,” American Journal of Human Genetics 76 (2005): 268-76, discusses DNA analysis of more than 3,600 individuals who were then classified into ethnic groups based on their DNA samples. Four categories emerged (black, white, Asian, and Hispanic) which correspond to the categories used in this analysis.
[13] Several sources detail the ancestry of the Latin American countries. According to Los Medios y Mercados de Latinoamerica 1998 (retrieved in Novem er 2004 from www.zonalatina.com/Zldata55.htm), the ancestry percentages for different ethnic groups in each country in South and Central America sum to: white/European 34 percent, mestizo (European/Indian mix) and mulatto (Euro pean/black mix) 57 percent, Indian (native indigenous people) 4 percent, black (African ancestry) and other 3 percent. Other sources with similar data include en.wikipedia.org/wiki/Mestizo, www.infoplease.com/ipa/A0855617.html (checked in November 2004). According to Latin writer Emily Monroy, “Most Latin Americans have at least some European ancestry,. . . some nations are over 80 percent’white,’ and many others possess substantial ‘white’ minorities…. Setting ‘white’ inhabitants aside, the average mestizo or mulatto has more in common with his or her European forebears [than his or her] Indian or African ones.” These data further solidify the combination of Spain and Portugal into the Latin ethnic group. Retrieved in November 2004 from www.analitica.com/ bitblioteca/emily_monroy/western.asp.
[14] “Racial Classification in Latin America,” Zona Latina, retrieved in November 2004 from www.zonalatina.com/Zldata55.htm.
[15] Hereafter, I will use ~ to mean “approximately,” as in “~23 percent.”
[16] I calculated the total population of LDS members of Polynesian descent in 2002 as 180,000 Church members in the Pacific Islands. I estimated 100,000 members of Polynesian descent in western countries (mainly the United States in Utah, California, and Hawaii) based on the assumption that ~10 percent of all members in predominantly “white” countries are of nonwhite ethnicity and that ~15 percent of these nonwhite members are of Polynesian descent. Because of the high numbers of Church members in the Polynesian countries overall, Polynesians could be expected to represent a high percentage of Church members in the United States as well.
[17] According to the Black Mormon homepage, there are “anywhere from 350,000 to perhaps 500,000” black members today. “About 150,000 black Mor mons live in Africa, about 150,000 live in Brazil (~20 percent of all members in Brazil), about 20,000 in the Caribbean, anywhere from 20,000 to 50,000 in the U.S. and the rest live in other countries.” Darrick Evenson, “Black Mormons Worldwide,” Black Mormon Homepage, retrieved in November 2004 from www.angelfire.com/mo2/blackmormon/000Hl 5.html. The 20,000-50,000 number could also be estimated based on the ~130 stakes in the sixty-seven largest cities in the United States. There would need to be 154 black members per stake (5 percent of the stake’s membership assuming 3,000 members per stake) to have 20,000 blacks in the United States or 385 black members per stake (13 percent of the stake’s membership assuming 3,000 members per stake) to have 50,000 blacks in the United States. These numbers seem reasonable based on my visits to multiple city wards in the United States.
[18] Haiti has 8,100 members, Jamaica has 4,200, Trinidad has 1,600 (a population of mixed Indian and African ancestry), Barbados has 600, Bahamas has 500, while Antigua, Bermuda, and St. Kitts have 100 members apiece. I exclude the Dominican Republic with its racially mixed population.
[19] Ethnically European countries are all European countries (excluding Spain and Portugal), Canada, the United States, Australia, and New Zealand. I calculated the number of Latin American Mormons in these ethnically European countries by totaling their membership (~6.65 million) and assuming that 10 percent of the total membership in these countries is made up of minorities (-665,000). Of the 665,000 ethnic members, I assumed that 50 percent (-332,000) were of Latin descent, 35 percent (-233,000) were of Asian/Polynesian descent (including a large number of Maori members in New Zealand and a large number of Asians in Hawaii), and 15 percent (-100,000) were of African descent. This percentage breakdown among ethnic groups resembles my personal observations of the racial makeup in many urban U.S. wards.
[20] I performed the calculations for 1992 using the same methodology as for the 2002 calculations. The only difference was that I assumed the percentage of minorities in ethnically European countries as 5 percent of the total LDS membership in these countries with 50 percent of these members as Latin, 40 percent Asian/Polynesian, and 10 percent black. This lower percentage for black members in these countries is similar to the low numbers of African members in 1992, only fourteen years after the priesthood ban had been lifted.
[21] “Historic Milestone Achieved,” 76.
[22] As these ethnic groups grow in size, the law of large numbers will result in a slower growth rate, but it is unlikely that the growth rates in Latin America, the Caribbean, parts of Asia, and Africa will slow considerably in the near future. Thus, the analysis should be useful through at least 2020. The law of large numbers means that, as a number grows larger, it is impossible to continue the same growth rate, given the large number of new converts required. For example, if the Church had 10 million members and a 5 percent growth rate, it would need to baptize 500,000 members each year to maintain that rate; but if the Church had 100 million members and a 5 percent growth rate, it would need to baptize 5 million members a year to sustain the 5 percent growth rate.
[23] I determined ethnic status by noting each individual’s facial features in his photograph and his country of birth. The minorities who were serving as General Authorities at the end of 2003 include (with their Quorum of the Seventy listed in parenthesis followed by their native country): Angel Abrea (1, Argen tina), Carlos Amado (1, Guatemala), Claudio Costa (1, Brazil), Walter Gonzalez (1, Uruguay), Yoshihiko Kikuchi (1, Japan), Carl Pratt (1, Mexico), Francisco Vinas (1, Spain), and Adhemar Damiani (2, Brazil). Those who served from 1992 to 2002 and have been released include (with their native country and years of service in parenthesis): Horacio Tenorio (Mexico, 1989-94), Eduardo Ayala (Chile, 1989-94), Helvecio Martins (Brazil, 1990-95), Julio Davila (Colombia, 1991-96), Jorge Rohas (Mexico, 1991-96), Han In Sang (Korea, 1991-96), Sam Shimabukuro (Japanese American from Hawaii, 1991 -96), Lino Alvarez (Mexico, 1992-97), Augusto Lim (Philippines, 1992-97), Tai Kwok Kuen (Hong Kong, 1992-97), Eran Call (Mexico, 1997-2000), and Athos Amorim (Brazil, 1998-2003).
[24] For more information on ethnic minorities in the Church throughout the world, see Bradley Walker, “Spreading Zion Southward: Part I,” Dialogue: A Journal of Mormon Thought 35, no. 4 (Winter 2002): 91-109; Bradley Walker, “Spreading Zion Southward: Part II,” Dialogue: A Journal of Mormon Thought 36, no. 1 (Spring 2003): 33-47; Henri Gooren, “Analyzing LDS Growth in Guatemala: Report from a Barrio,” Dialogue: A Journal of Mormon Thought 33, no. 2 (Summer 2000): 97-115; Armand L. Mauss, All Abraham’s Children (Urbana: University of Illinois Press, 2004).
[25] “Image of Yankee Imperialism Hurting LDS in South America,” Salt Lake Tribune, August 21, 1991, A-1.
[26] The average number of new members per year from 1992 to 2002 was 360,000. This is due to ~280,000 converts and ~80,000 children of record baptized each year.
[27] Walker, “Spreading Zion Southward: Part II”; see also notes 3-6 for additional references.
[28] John-Charles Duffy and Hugo Olaiz, “Correlated Praise: The Development of the Spanish Hymnal,” Dialogue: A Journal of Mormon Thought 35, no. 2 (Summer 2002): 89-113.
[29] Edward Kimball, ed., The Teachings of Spencer Kimball (Salt Lake City: Bookcraft, 1984); Tina Hatch, “‘Changing Times Bring Changing Conditions’: Relief Society, 1960 to the Present,” Dialogue: A Journal of Mormon Thought 37, no. 3 (Fall 2004): 65-98.
[30] Dean L. Larsen, “The Challenges of Administering a Worldwide Church,” Ensign, July 1974, 20.
[31] While this manuscript was in revision, Apostles David B. Haight and Neal A. Maxwell died. These two vacancies were filled by David A. Bednar and Dieter Uchtdorf, both ethnic Europeans, although the latter, a German, is the first non-U.S.-born apostle called since John A. Widtsoe (born in Norway) was called in 1921. Marion G. Romney, called as an Assistant to the Twelve in 1941, was born in Colonia Juarez, a Mormon colony in Mexico.
[32] For the 1980 sesquicentennial, the Sunday morning session of April conference was held in Palmyra, New York.
[33] In May 1999, my ward, the Revere II, held its sacrament meeting in Cambodian with English translation. The feedback was mixed. Some members thought it was a fantastic idea, while others felt that they did not receive the full message due to the translation.